Thought a thread devoted to population stats would be a good addition to our site. Start with the following -
From the Australian P27 - 28 'Population Boom Causes Rethink By Urban Planners'. Printed in part.
There has been a fundamental change in thinking by demographers about the medium term outlook for population growth in Australia.
In Sept. the ABS published a medium projection that showed the nation adding 6.6M residents over the next 20 years to 2026.
Just two years earlier, the official outlook for this period was was net growth of 3.7m.
The extra 3.2m residents materialised out of new trends and data flowing from the 2006 census and changes to migration policy that upped the net migration assumption.
The bottom line is that the birth rate was lifted and the assumption regarding regarding the overseas migration was also lifted from 110000 to 180000 per year.
What this effectively meant was that strategic plans that had been developed for capital cities between 2002 and 2006 (and based on 2001 census results) including documents like Melbourne 2030 and Syney's city of cities , had to be rethought.
Here are some of the top 70 predictions as a result
National Projected Population Growth
2006 2026 City. State 2006 2026 Gain Percent.
1 1 Sydney NSW, 4 281 988, 5 426 260, 1 144 272 , 27%
2 2 Melbourne VIC 3 743 015, 5 038 113, 1 295 098, 35%
3 3 Brisbane QLD 1 819 762, 2 681 135, 861 373, 47%
4 4 Perth WA 1 518 748, 2 267 598, 748 841, 49%
5 5 Adelaide SA 1 145 812, 1 384 544, 238 732, 21%
6 6 Gold Coast QLD 565 311, 930 453, 365 142, 65%
7 7 Newcastle NSW 517 511, 634 928, 117 417, 23%
8 8 Canberra ACT 381 498, 488 234, 106 736, 28%
9 10 Wolongong NSW 277 984, 316 302, 38 318, 14%
10 9 Sunshine Coast QLD 244 059, 360 276, 136 217, 61%
20 22 Bendigo VIC 84 883, 110 426, 25 543, 30%
27 23 Bunbury WA 58 350, 101 541, 43 191, 74%
31 32 Mildura VIC 47 698, 60 445, 12 757, 27%
53 45 Mt. Barker SA 27 634, 41 314, 13 680, 50%
59 59 Mt Gambier SA 24 534, 28 088, 3 554, 14%
62 62 Whyalla SA 22 287, 24 101, 1 814, 8%
67 70 Broken Hill NSW 20 131, 17 796, - 2335, -12%
Source: Statistical Local Area Population Projections, 2007 - 2027
Of interest, Adelaide is not static or regressing as earlier predictions were suggesting, but is losing ground to the other capitals on the basis of parameters used for the above. I would suggest that the effect of ODX is not included, the recession effects not included and also that some of these figures appear inflated. Eg Mt Gambier was 23 000 in 2006 and is just under 25 000 now.
Enjoy, guys!
SA - STATE ON THE MOVE.
DEMOGRAPHICS
Re: DEMOGRAPHICS
It is important to note that the figures are based on projections from 2006. 2006 was right in the middle of the boom. As such I think such figures do not reflect the realities of today. For example I do not think that Perth will record such high population growth rates from now on.

Re: DEMOGRAPHICS
Just for interests sake, here is the article by Bernard Salt that corresponds to the data above:
Population boom forces rethink by urban planners
DEMOGRAPHER: Bernard Salt | March 05, 2009
Article from: The Australian
THERE has been a fundamental change in thinking by demographers about the medium-term outlook for population growth in Australia.
In September, the Australian Bureau of Statistics published a medium projection that showed the nation adding 6.9 million residents over the 20 years to 2026.
Just two years earlier, the official outlook for this period was net growth of 3.7 million.
The extra 3.2 million residents materialised out of new trends and data flowing from the 2006 census and changes to migration policy that upped the net migration assumption.
The bottom line is that the birth rate was lifted and the assumption regarding overseas migration was also lifted from 110,000 to 180,000 per year.
What this effectively meant was that strategic plans that had been developed for capital cities between 2002 and 2005 (and based on 2001 census results), including documents like Melbourne 2030 and Sydney's City of Cities, had to be rethought.
And that is precisely what's happening right now.
New plans are being developed for raised expectations of growth.
But the problem has always been that the ABS develops this national view about population growth and it is then left up to the states to work out how and where growth is to be accommodated.
And the states are doing exactly that: new population forecasts are being prepared which allocate growth, based on preferred planning principles, at the local government area level.
This is an important process for the property development industry to understand because it provides an "official outlook" for the demand for housing and associated infrastructure. But the problem with the state projections is that when aggregated they didn't always tally with the ABS view of national growth. Or this was the problem until now.
The ABS was commissioned last year by the Department of Health and Ageing to develop population projections for every local government area on the Australian continent.
The output is the first publicly available population projection at the small area level where all the bits add to an agreed national outlook. (See www.health.gov.au)
This is a very powerful database for two reasons.
First, it shows the scale and location of growth across the nation and second, it carries the gravitas of a nationally co-ordinated perspective produced by this nation's foremost demographer, the ABS.
In other words, it's a good document to cite in an argument about rezoning, or in the development approval process. But the advantage of the DoHA database goes further than working out where demand for property will be greatest: it can also indicate where current zoning must be rethought in the short term.
Maybe you have developable land located just beyond an "urban growth boundary" or similar; this document and its logic might just be the leverage needed to change local planners' thinking.
Here are just a few examples of where planners, working off dated projections anchored to the 2001 census, must expand their plans for housing and other infrastructure.
The previous outlook for Melbourne showed the city adding 654,000 residents over the 20 years to 2026; the new projections lifts this number to 1.3 million. Sydney was to add 754,000 in this time frame, whereas the number now is 1.1 million.
Strategic planning for the Gold Coast was based on the expectation of 240,000 residents being added over the 20 years to 2026, whereas the new outlook is for 365,000.
Even the outlook for places like Wagga has been upped from 6000 under the old state projections to 16,000 under the DoHA projections.
A net extra 10,000 residents for Wagga means a new suburb must be delivered by 2026.
One of the issues with the DoHA database is that the projections are published by small area. We have aggregated all of the required small areas to align with the current definition of the 70 largest cities and towns in Australia. This is the first time anything like this has been done and it provides a unique opportunity to identify and prioritise property and infrastructure development opportunities.
The town that is expected to support the greatest percentage increase in population over the projection period is Hervey Bay. This community is expected to grow from 51,000 residents in 2006 to 102,000 in 2026, which is a 99 per cent increase.
The projections show that Hervey Bay will double within 20 years. It is already this nation's 29th largest city; by 2026 "the Bay" will rank 24th.
Other rocket towns include Bunbury, projected to grow by 74 per cent over the 20 years to 2026, followed by Gladstone (up 68 per cent), the Gold Coast (up 65 per cent), Mandurah (up 64 per cent), Busselton (up 62 per cent) and Cairns and the Sunshine Coast (both up 61 per cent).
The common denominator of these places is their sea-change lifestyle, although Bunbury and Gladstone have local manufacturing and port-handling capacities.
But the projections aren't all about rapid growth.
Some towns are expected to grow slowly over 20 years, with population increases under 10 per cent, such as Burnie-Devonport, Orange, Griffith, Grafton, Whyalla, Armidale and Innisfail.
Towns expected to actually lose population include Goulburn, Lithgow, Broken Hill and Ayr.
A key assumption driving the projections is that recent migration trends will be carried forward.
Migration from small rural communities prompted by drought early this decade is implicit in many of the projections. It may well be that the fortunes of towns like Orange, for example, reverse as the drought recedes. But places like Orange might well be on the frontline of Australian demographic change brought about by effects of climate change.
The projections contain a number of surprises.
Victoria's Latrobe Valley was projected by old state-based forecasts to remain more or less static in terms of population levels over 20 years to 2026.
However, the DoHA projections show the Latrobe Valley population rising from 76,000 in 2006 to 88,000 in 2026. It would appear that Gippsland planners must accommodate the unexpected inflow of 12,000 residents, although the reality is that local planners will most likely await publication of state forecasts before carving out new subdivisions.
Dated projections for Canberra-Queanbeyan assumed that 46,000 new residents would be added by 2026, whereas the new projections lift this outlook to 107,000. Canberra planners must now accommodate an extra 60,000 residents within 20 years.
One concern business will have about this new perspective on the small area population outlook for Australia is how the assumptions might be affected by the global financial crisis.
For example, there is already talk of reductions in the migrant intake.
However, the DoHA outlook assumes net migration of 180,000. In the year to September last year, this figure actually stood at 213,000.
The fact is that net migration to Australia can be reduced by about 15 per cent before breaching the long-term assumption driving the projection. And there are important reasons why net migration should be maintained over the longer term, not the least of which is the need to sustain workforce and tax growth as baby boomers retire next decade.
Finally, if the recession is even worse in New Zealand than in Australia, we can expect the "Tasman Tide" to again begin ebbing in our direction.
I think the more pressing impact of the global financial crisis on the DoHA projections will be the advent of unique economic and lifestyle factors.
The collapse of coal exports, for example, may have a localised impact on job and population growth in Gladstone, Mackay and Bunbury.
Spectacular recovery from drought may change the outlook for Orange and Goulburn.
Concern about the effects of UV rays may prompt accelerated migration to Tasmania.
A prolonged recession might diminish the capacity of retirees and lifestylers to support classic sea-change communities such as the Gold Coast.
On the other hand, Australians have shown a clear predilection for using trigger events, such as job loss, as a reason to reinvent themselves in a new community on the coast.
Taking all this into account, my overall view is that even if migration is damped down during the recession, it must at a later date spring back to prop up the worker and tax base.
This logic at the national level supports the aggregate of the DoHA projections over 20 years, even though there may be yearly variances.
Nevertheless, you must decide how the global financial crisis might or might not distort the base picture presented in this newand most important set of projections.
-
skyliner

- Super Size Scraper Poster!
- Posts: 2359
- Joined: Tue Oct 24, 2006 9:16 pm
- Location: fassifern (near Brisbane)
Re: DEMOGRAPHICS
I totally agree! Dampeners are also in store also for B'bane concerning coal exports and climate change. (30 coal mines in QLD).Will wrote:It is important to note that the figures are based on projections from 2006. 2006 was right in the middle of the boom. As such I think such figures do not reflect the realities of today. For example I do not think that Perth will record such high population growth rates from now on.
ADELAIDE - TOWARDS A GREATER CITY SKYLINE
Jack.

Re: DEMOGRAPHICS
South Australia has reached a population of 1.608m but our growth rate was the second-slowest in the country.
http://www.abc.net.au/news/stories/2009 ... =australia
http://www.abc.net.au/news/stories/2009 ... =australia

Re: DEMOGRAPHICS
Thats crap!!!!! Come on ADELAIDE!! You can do betterSplashmo wrote:South Australia has reached a population of 1.608m but our growth rate was the second-slowest in the country.
http://www.abc.net.au/news/stories/2009 ... =australia
South Australia the Festival State

Re: DEMOGRAPHICS
I would expect the ABS gets births, deaths and overseas migration data from the relevant government departments, and would get interstate migration figures from the likes of drivers licenses, Medicare, etc. The latter is an incomplete picture. The Census provides the baseline.Will wrote:It is important to note that the figures are based on projections from 2006. 2006 was right in the middle of the boom. As such I think such figures do not reflect the realities of today. For example I do not think that Perth will record such high population growth rates from now on.
-
stumpjumper
- Legendary Member!
- Posts: 1497
- Joined: Sat Aug 13, 2005 10:10 pm
Re: DEMOGRAPHICS
Actually it isn't crap. You are interpreting the result in an incorrent manner. Although it is true that we have the second lowest population growth rates in the country, this isn't something new. We have always had lower population growth rates compared to other states. The more important aspect of the data that we should take away is that we are growing at 1.1% per annum. Although we can do better, it is important to point out that we have not had such strong population growth since the 1970s.joshzxzx wrote:Thats crap!!!!! Come on ADELAIDE!! You can do betterSplashmo wrote:South Australia has reached a population of 1.608m but our growth rate was the second-slowest in the country.
http://www.abc.net.au/news/stories/2009 ... =australia

Re: DEMOGRAPHICS
New Population figures are out for December 2008. Between December 2007 and December 2008, SA's population grew by 18k people, or 1.2%.
Adelaide's population grew by 12k over the same period, or 1.12%.
Adelaide's population grew by 12k over the same period, or 1.12%.
Re: DEMOGRAPHICS
Thats it Adelaide....
Slightly higher..
Bring on 2%
Slightly higher..
Bring on 2%
South Australia the Festival State
Re: DEMOGRAPHICS
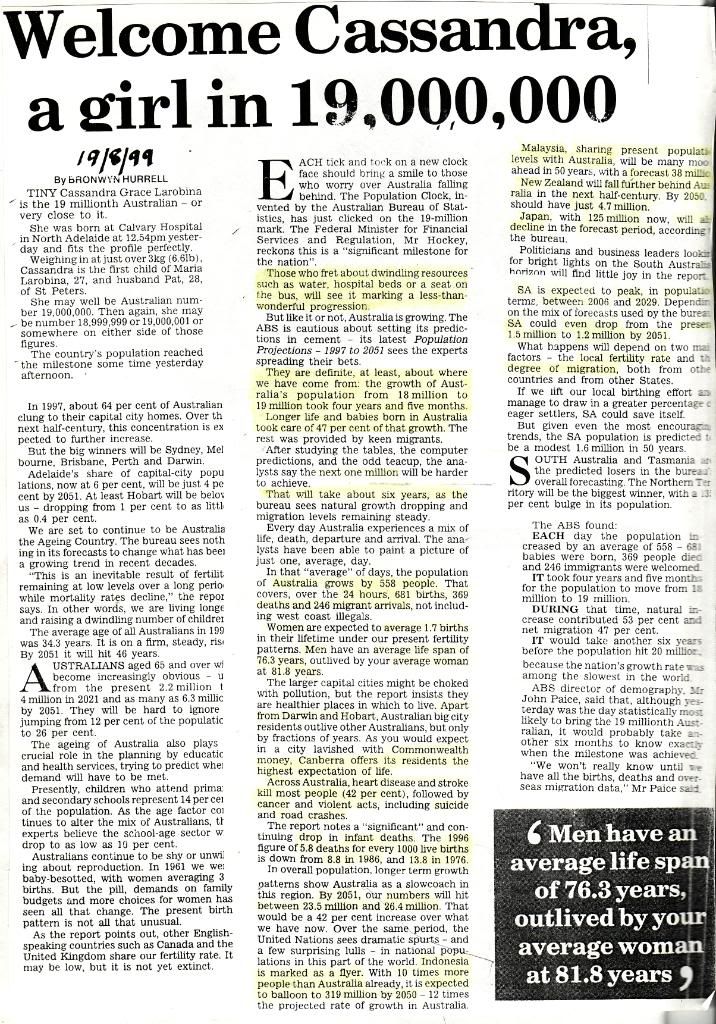
This article from The Advertiser is from 1999. Although it made for very depressing reading at the time, now when i read it, it makes me reflect on how much SA has changed in 10 years. To think that the best projection in 1999 had SA's population growing to just 1.6 million by 2050, today, the best projection has SA reaching 2.5 million in 2050.
Re: DEMOGRAPHICS
The article perfectly highlights how wrong projections can be. It predicted that Australia's population would be between 23.5 million and 26.4 million in 2050. There's already well over 22 million of us in 2010 and now the predictions are for at least 35 million. Using the past to predict the future isn't always the best way of doing things because the factors and challenges that are influencing the population are also changing over time.
-
Briggzy_03
- High Rise Poster!
- Posts: 136
- Joined: Tue Aug 26, 2008 7:34 pm
Re: DEMOGRAPHICS
I guess it just goes to show that projections should be taken with a grain of salt.Will wrote:This article from The Advertiser is from 1999. Although it made for very depressing reading at the time, now when i read it, it makes me reflect on how much SA has changed in 10 years. To think that the best projection in 1999 had SA's population growing to just 1.6 million by 2050, today, the best projection has SA reaching 2.5 million in 2050.
I think it's a positive for Adelaide that our growth rates aren't as high as Brisbane or Perth, the consequences caused from high growth i.e. congestion, stress on infrastructure especially for Brisbane will be a real problem. Confidence is growing in the state as well as our economic potential so migration numbers could possibly increase in the coming years.
Re: DEMOGRAPHICS
It really makes you wonder how our population almost doubled during the Playford era from 600,000 to 1.1 million
Don't burn the Adelaide Parkland (preservation society)
Who is online
Users browsing this forum: No registered users and 3 guests